Inequality amblyopia is a condition affecting some conservatives, who simply cannot see inequality when looking directly at it. The facts and figures that convince objective observers that there
is increasing inequality in our nation, are simply not visible to them.
As in childhood amblyopia, or ‘lazy eye’ as it is called colloquially, there is nothing wrong with the eye. Amblyopia results from a developmental problem in the brain, not the eye. The part of the brain that receives images from the amblyotic eye is not stimulated properly.
In conservatives that part of the brain is where political concepts, ideology and entrenched beliefs live. So ingrained are these beliefs that no contradictory facts or figures can erase them. The beliefs are unshakable. Evidence has no impact; it is invisible.
This is why Scott Morrison was able to argue that rather than increasing in Australia,
inequality was decreasing! He said:
“The latest census showed on the global measure of inequality, which is the Gini coefficient, that is the accepted global measure of income inequality around the world, and that figure shows it hasn’t got worse, it has actually got better,”
Even if Morrison actually understood how the Gini coefficient was computed, what it measured, and the nuances that surround it, he is pushing his luck to base his refutation of Shorten’s inequality claim using only the Gini to 'prove' that inequality is decreasing, not increasing. More of this later.
For those not familiar with this measure of inequality, the following explanation extracted from
Investopedia may be of value.
The Gini index or Gini coefficient is a statistical measure of distribution developed by the Italian statistician Corrado Gini in 1912. It is often used as a gauge of economic inequality, measuring income distribution or, less commonly, wealth distribution among a population. The coefficient ranges from 0 (or 0%) to 1 (or 100%), with 0 representing perfect equality and 1 representing perfect inequality. A country in which every resident has the same income would have an income Gini coefficient of 0. A country in which one resident earned all the income, while everyone else earned nothing, would have an income Gini coefficient of 1.
The same analysis can be applied to wealth distribution (the "wealth Gini coefficient"), but because wealth is more difficult to measure than income, Gini coefficients usually refer to income and appear simply as "Gini coefficient" or "Gini index," without specifying that they refer to income. Wealth Gini coefficients tend to be much higher than those for income.
Morrison has likely made his assertion after reading the 12th iteration of The University of Melbourne
Melbourne Institute’s annual study of
The Household, Income and Labour Dynamics in Australia Survey (HILDA). The preface to the HILDA Survey explains that it ‘
…seeks to provide longitudinal data on the lives of Australian residents. It collects information annually on a wide range of aspects of life in Australia, including household and family relationships, child care, employment, education, income, expenditure, health and wellbeing, attitudes and values on a variety of subjects, and various life events and experiences. Information is also collected at less frequent intervals on various topics, including household wealth, fertility-related behaviour and plans, relationships with non-resident family members and non-resident partners, health care utilisation, eating habits, cognitive functioning and retirement.’
The important distinguishing feature of the HILDA Survey is that the same households and individuals, 17,000 persons in all, are interviewed every year, allowing the study to see how their lives are changing over time.
Of relevance to this piece is one of the findings of this year’s HILDA: ‘
The Gini coefficient, a common measure of overall inequality, has remained at approximately 0.3 over the entire 15 years of the HILDA Survey.’
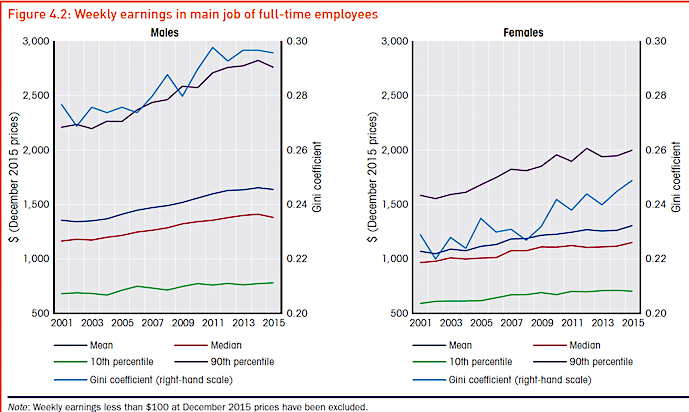
The flakiness of using this measure to support a political point of view about the level of inequality in Australia is illustrated by Figure 4.2 on page 48 of the
2017 HILDA Survey, which details the Gini coefficient up to 2015 for males and females based on the weekly earnings of full-time employees. The graphs show a tiny downward flick for males (indicating less inequality), but there is a larger upward flick for females (indicating more inequality). The movements are so small that to claim inequality is decreasing is patently dishonest, particularly as the Gini for males and females go in opposite directions, females more than males.
Do take a look at Figure 4.2 below to convince yourself of Morrison’s deception.

The
OECD Economic Survey Australia 2017 also comments on the Gini. It states: ‘
The Gini coefficient has been drifting up [towards inequality]
and households in upper income brackets have benefited disproportionally from Australia’s long period of economic growth. Real incomes for the top quintile of households grew by more than 40% between 2004 and 2014 while those for the lowest quintile only grew by about 25%.
You may care to look at Figure 3
on page 8 of this report that compares the Gini coefficient of Australia, Canada and the US. It shows how much the income of the top 1% has grown, as it benefitted most from the economic boom.
So let’s dismiss any serious claim that Gini ‘proves’ that inequality is decreasing in Australia. There is so much other evidence to the contrary that inequality amplyopia must be affecting the brains of those who argue so.
Conservative commentators too, such as Adam Creighton, economics correspondent for
The Australian, and Paul Kelly, editor-at-large, were quick to attack Shorten’s call of inequality. Creighton wrote a headline in
The Weekend Australian of July 22-23 that read:
ALP’s ‘false’ pitch on inequality. He goes on to assert that Shorten’s claim that inequality is at a 75-year high is ‘patently false’. Creighton supports his argument by quoting Professor Roger Wilkins, author of HILDA, who told an Economic and Social Policy conference that “
Inequality is still relatively high by modern standards but the narrative that says inequality is ever rising is patently false…”, and that the proportion of Australians over 15 with incomes less than half the median level of income had fallen to about 10%, adding “
That if anything inequality has been declining”.
So the game, as always, is to quote the data, or the person that supports the argument being made. This is what Morrison, Creighton and Kelly have done, shamelessly, although it flies in the face of the facts and figures.
Yet, ask the average person in the street whether they believe that they, or Australians in general, are becoming better off or worse, and the predominant answer will be ‘WORSE’.
Writing in
Crikey, political editor Bernard Keane says: ‘
We're missing the point on inequality. Arcane debates about measures of inequality don't deal with the day to day perceptions of voters of an economic system that has stopped delivering for them.’
He goes on: ‘
Is inequality in Australia getting worse? Is the Gini coefficient going up or down? Who’s right, Bill Shorten or Scott Morrison and the conservative newspapers beating the bushes for academics who’ll back them up? It doesn’t matter, and the longer the government and its media allies debate it, the more they’ll play into Shorten’s hands on what will become a key issue for the next election.
'Inequality is a central outcome of the kind of market-based economic reforms we’ve pursued since the 1980s. That’s how neoliberalism works. It has made us all wealthier – even the poorest Australians are wealthier than they were 30 years ago, in real terms. But the wealthiest have benefited more than the rest of us. This is indisputable.'
Writing in the same issue of
Crikey Helen Razer says
‘Inequality IS the point’. She continues: ‘
Inequality has reached a crisis point in Australia, no matter your definition. The poor can't afford homes or electricity, and something has to be done. Rising inequality, says the Leader of the Opposition, is a terrible fact of Australian life. Rising inequality, says the Treasurer, is a non-fact that opposition leaders evoke when what they really want to do is stunt economic growth.
'The Herald Sun says that everyone should just shut up about rising inequality, because causing people to worry about what they don’t have and can’t get is a destructive “politics of envy”. There’s no point in scrutinising the odd claims of the Herald Sun – it’d be a bit like arguing with my Aunty Dot about global warming three sherries in. But there must be a point in scrutinising what is meant by “inequality” and how much of it we have, or don’t have, in this nation.’
Also in
Crikey Alan Austin writes: ‘
Company reporting season begins this week with confidence sky high that record annual profits will be achieved. With these will come exciting news of higher executive salaries, well-earned performance bonuses and, of course, increased shareholder dividends. These are already being hailed by the corporate media as proof that all is well with the world. Meanwhile, data on Australia’s economy published in July confirms two things. First, that much of the increased income and wealth accruing to rich corporations and individuals is taken from the poor and the middle. And second, that this rate of transfer is accelerating.’
Peter Martin, economics editor at
The Age frontally addresses the disparity between Shorten’s claims and Morrison’s in his article:
HILDA. Why we're suddenly concerned about inequality. Things have stopped getting better.
Martin begins:
'Bill Shorten's on to something. Not the pointless debate over inequality – whether it's rising or not depends on what you measure – but the truth that lies beneath the debate. It's that, unusually, life is getting harder.'
He goes on:
'In all but four of the past 15 years, things were getting better. Two of those four years followed the global financial crisis. The other two were the two most recent years for which we have data: the first two full years of the Abbott-Turnbull government. It means that whereas before the election of Tony Abbott, a typical Australian family took home about what it did in 2009, it now takes home less, after adjusting for inflation.'
He quotes Shorten: ‘
As Shorten put it in a speech that purported to be about inequality but was actually about declining real incomes, "It feeds that sense, that resentment, that the deck is stacked against ordinary people, that the fix is in and the deal is done." We didn't get that sense when ordinary incomes were rising, even though inequality was widening. Only now, when real incomes are slipping, do we feel resentful. And it's mainly men who are resentful. Female earnings are trending up, especially those of women employed full-time. Male earnings are trending down.’
Can Morrison or Creighton or Kelly counter these feelings? Especially when the average Joe sees corporate high fliers sitting on salaries and bonuses that often run into millions. No, not with their amblyotic vision! The visual centre in their brains can’t process the facts and figures that we all can see.
Let’s look at some of the facts that Martin extracted from HILDA:
Education:
‘
University graduates earn much less than their predecessors used to ($1023 a week, down from $1468) and they are much less likely to be in full-time jobs four years later (73 per cent, down from 91 per cent). Australians with only a high school qualification are even worse off. When the survey started, 81 per cent of them were employed full-time within four years. Now it's 62 per cent.’
Work:
‘
As more and more of us work in part-time rather than full-time jobs, an increasing proportion are combining part-time jobs in order to work full-time. This means that part-time jobs are more common than the Bureau of Statistics survey suggests and that full-time jobs are harder to get.
Australians are working longer without waiting for the pension age to rise. The typical retirement age has climbed from 62 to 66 for men, and for 61 to 64 for women. And retirement is less likely to be a one-off event. Thirteen per cent of men who retired between the ages of 60 and 64 find themselves back at work within a year, up from 9 per cent. Seven per cent of the women who retired between 60 and 64 find themselves back at work in a year, up from 4 per cent.’
Superannuation:
‘Even now, a quarter of a century after the introduction of compulsory superannuation and 15 years after compulsory contributions of around 9 per cent, the balances of retirees are surprisingly low.
‘Thirty per cent of men retire without super, and 29 per cent of women. The men who do have super retire with a typical balance of $325,200; the women with $110,952. That typical balance is the median, meaning half of the retirees will have more, and half less. The mean (average) is much higher, pushed up by very big retirement balances at the top.
‘Retirees with low balances are highly likely to use them to pay off debts, obliterating 58 per cent of their super (men) or 70 per cent (women) in one go.’
Home ownership:
’Home ownership rates for the under-40s have collapsed. In 2002 when the survey began, 32.5 per cent of 18- to 39-year-olds owned a home. It's now 24.9 per cent.
‘The proportion of men in their early-20s living with their parents has jumped from 43 per cent to 60 per cent. The proportion of early-20s women staying at home has jumped from 27 per cent to 48 per cent.
‘Those who can buy houses find it hard to pay them off. The average mortgage taken out by a young homebuyer has almost trebled – jumping from $120,813 to $330,687. Going back to the same homeowners year after the year the survey finds that in most years the amount owed climbs as a substantial minority of young homeowners refinance or redraw or fall behind on their loans. HILDA author Wilkins says if they continue like this – using their mortgages to fund day to day expenses – there will be "real implications for future aged pension liabilities".’
Martin concludes: '
Australia remains a wealthy country. But it isn't absolute wealth (or even relative inequality) that matters most when it comes to our feelings. It's whether or not things are getting better. HILDA suggests they are getting worse.'
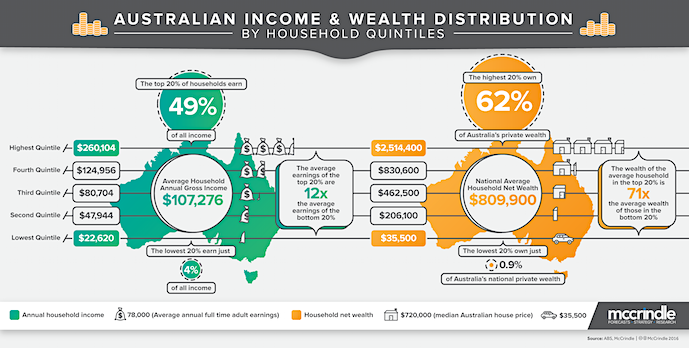
The following McCrindle image of
Australian Income and Wealth Distribution 2016 summarizes inequality in this country graphically:

Morrison, his Coalition colleagues, and their conservative cheerleaders in the media are petrified about the impact of Shorten’s inequality message. No matter what counter messages they shout over the airwaves or through the Murdoch media, they know that the people out there, most of whom have never heard of the Gini coefficient, let alone its variations over time, realize that they
are worse off than before, know that life is getting harder for them as their wages stagnate while the costs of living continue to rise. They know that as they struggle to pay off their mortgage and their rising power bills they have less and less for food and other essentials. No amount of tough talk from Morrison and Co., no amount of quoting Gini, no amount of slick political blather will convince them otherwise.
The sad fact is that despite these verifiable facts, Morrison and his Coalition colleagues are incapable of processing what everyone else can see, now reinforced by HILDA data. They can see the facts just as anyone else can, but because of their inequality amblyopia their brains cannot process these facts, distorted as their thinking is by inbuilt ideological biases and deeply entrenched beliefs. Their eyes see the facts; their brains cannot, and never will.
Only by recognizing this form of amblyopia will ordinary citizens ever be able to understand how conservatives can deny that life is getting more difficult for so many, how they can deny that inequality is increasing.
Shorten is on a winner.
 Postscript:
 If any of you doubt the soundness of the 'inequality amblyopia' allegory, you might be interested to read a pertinent article in Friday's issue of
The Conversation: How do you know that what you know is true? That’s epistemology by Peter Ellerton, Lecturer in Critical Thinking at The University of Queensland.
Current rating: 0 / 5 | Rated 0 times